The DARIAH-DE Geo-Browser
The DARIAH-DE Geo-Browser allows a comparative visualization of several requests and facilitates the representation of data and their visualization in a correlation of geographic spatial relations at corresponding points of time and sequences. Thus, researchers can analyze space-time relations of data and collections of source material and simultaneously establish correlations between them. This sample dataset for the Geo-Browser shows publishing dates and locations of works by Friedrich Schiller and Johann Wolfgang von Goethe plotted against each other.
The DARIAH-DE Geo-Browser is freely accessible on the internet: https://geobrowser.de.dariah.eu. All functions are provided without any registration. Geo-Browser is a tool for the visualization and analysis of space-time-relations for humanities scholars. The Geo-Browser shows a map of the world. By scrolling you can zoom in and out. On the left side is a zoom-bar, with which you can zoom in and out, by pulling the cursor to “+“ or “-“.
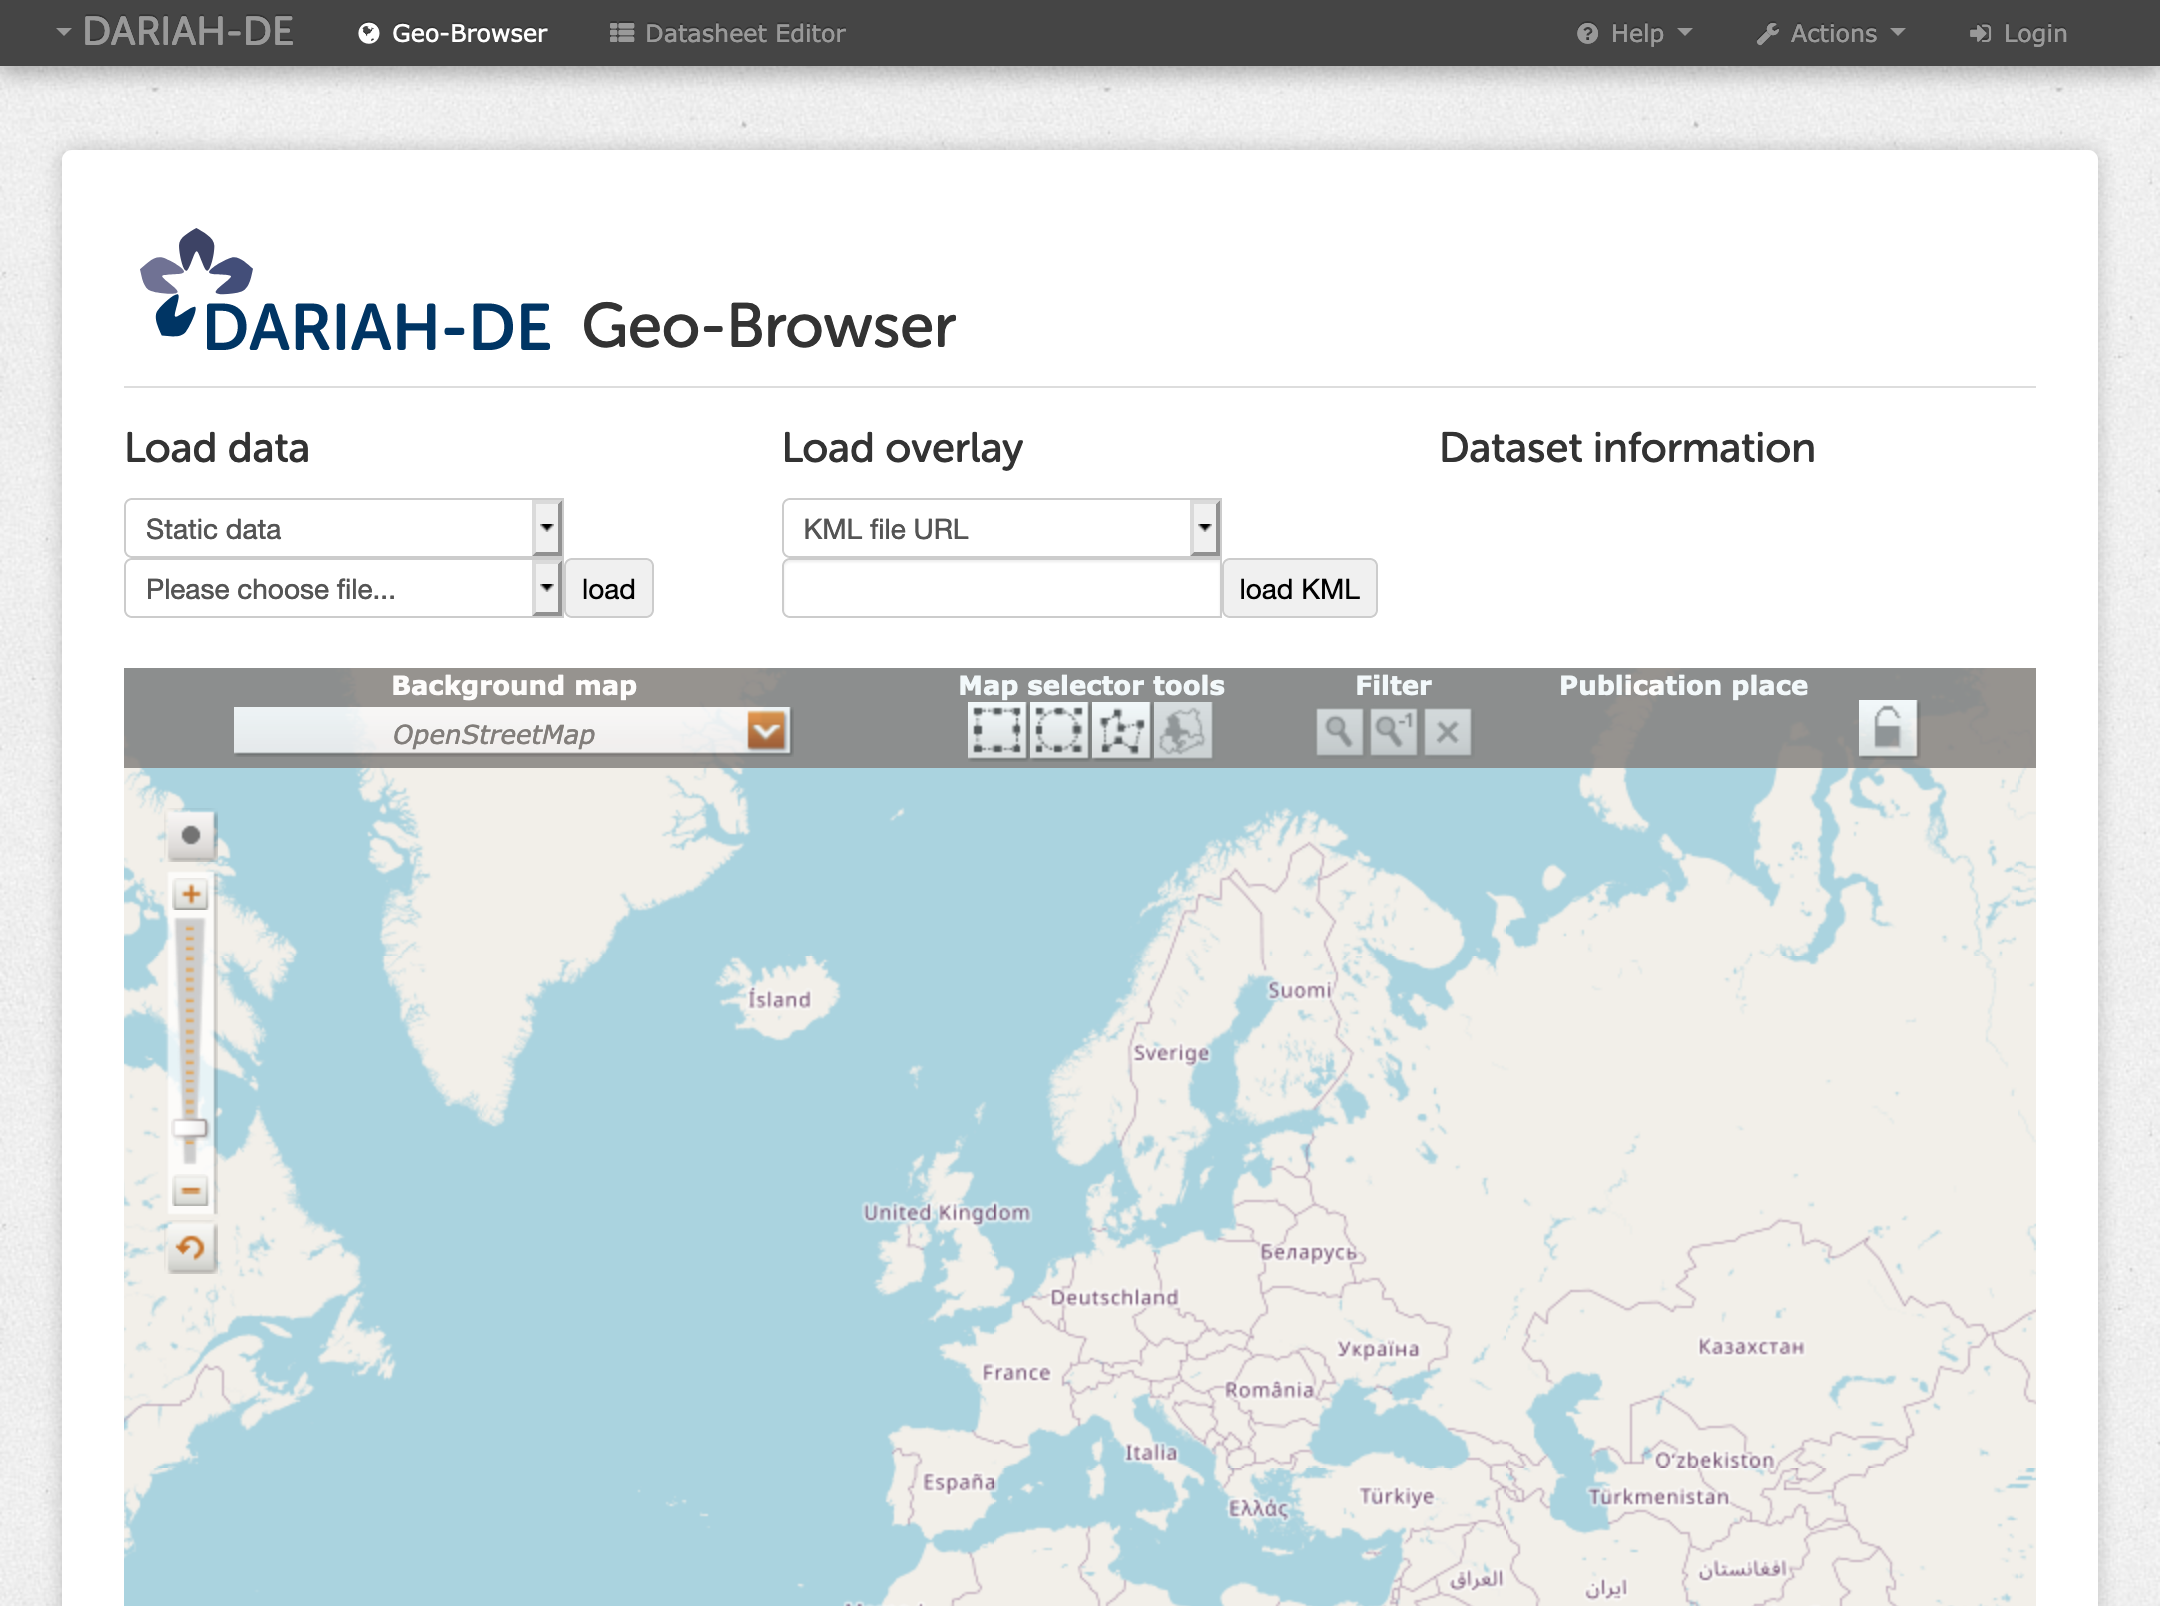
Fig. 1: The Geo-Browser start screen
More information concerning Geo-Browser and Datasheet Editor you can find at the DARIAH-DE Portal.
GUI Documentation
Load Data
In the upper part you can choose, which kind of data you want to upload in the geo-browser. With “Static Data” you can choose sample data. They are extracted from WebOPAC Göttingen, Flickr, the Internet Movie Database and from Wikidata and already preprocessed for the Geo-Browser. Static Flickr Data is using data from Flickr. Place and time of the user shots are recorded here. (Example for a search: Concerts of a certain band), “Political data” includes examples of political data. Static IMDB data uses data of the “Internet Movie Database“ and extracts the metadata time and place of the movie production. “DBPedia Queries“ is a collection of structured information of Wikipedia (https://wiki.dbpedia.org/About).
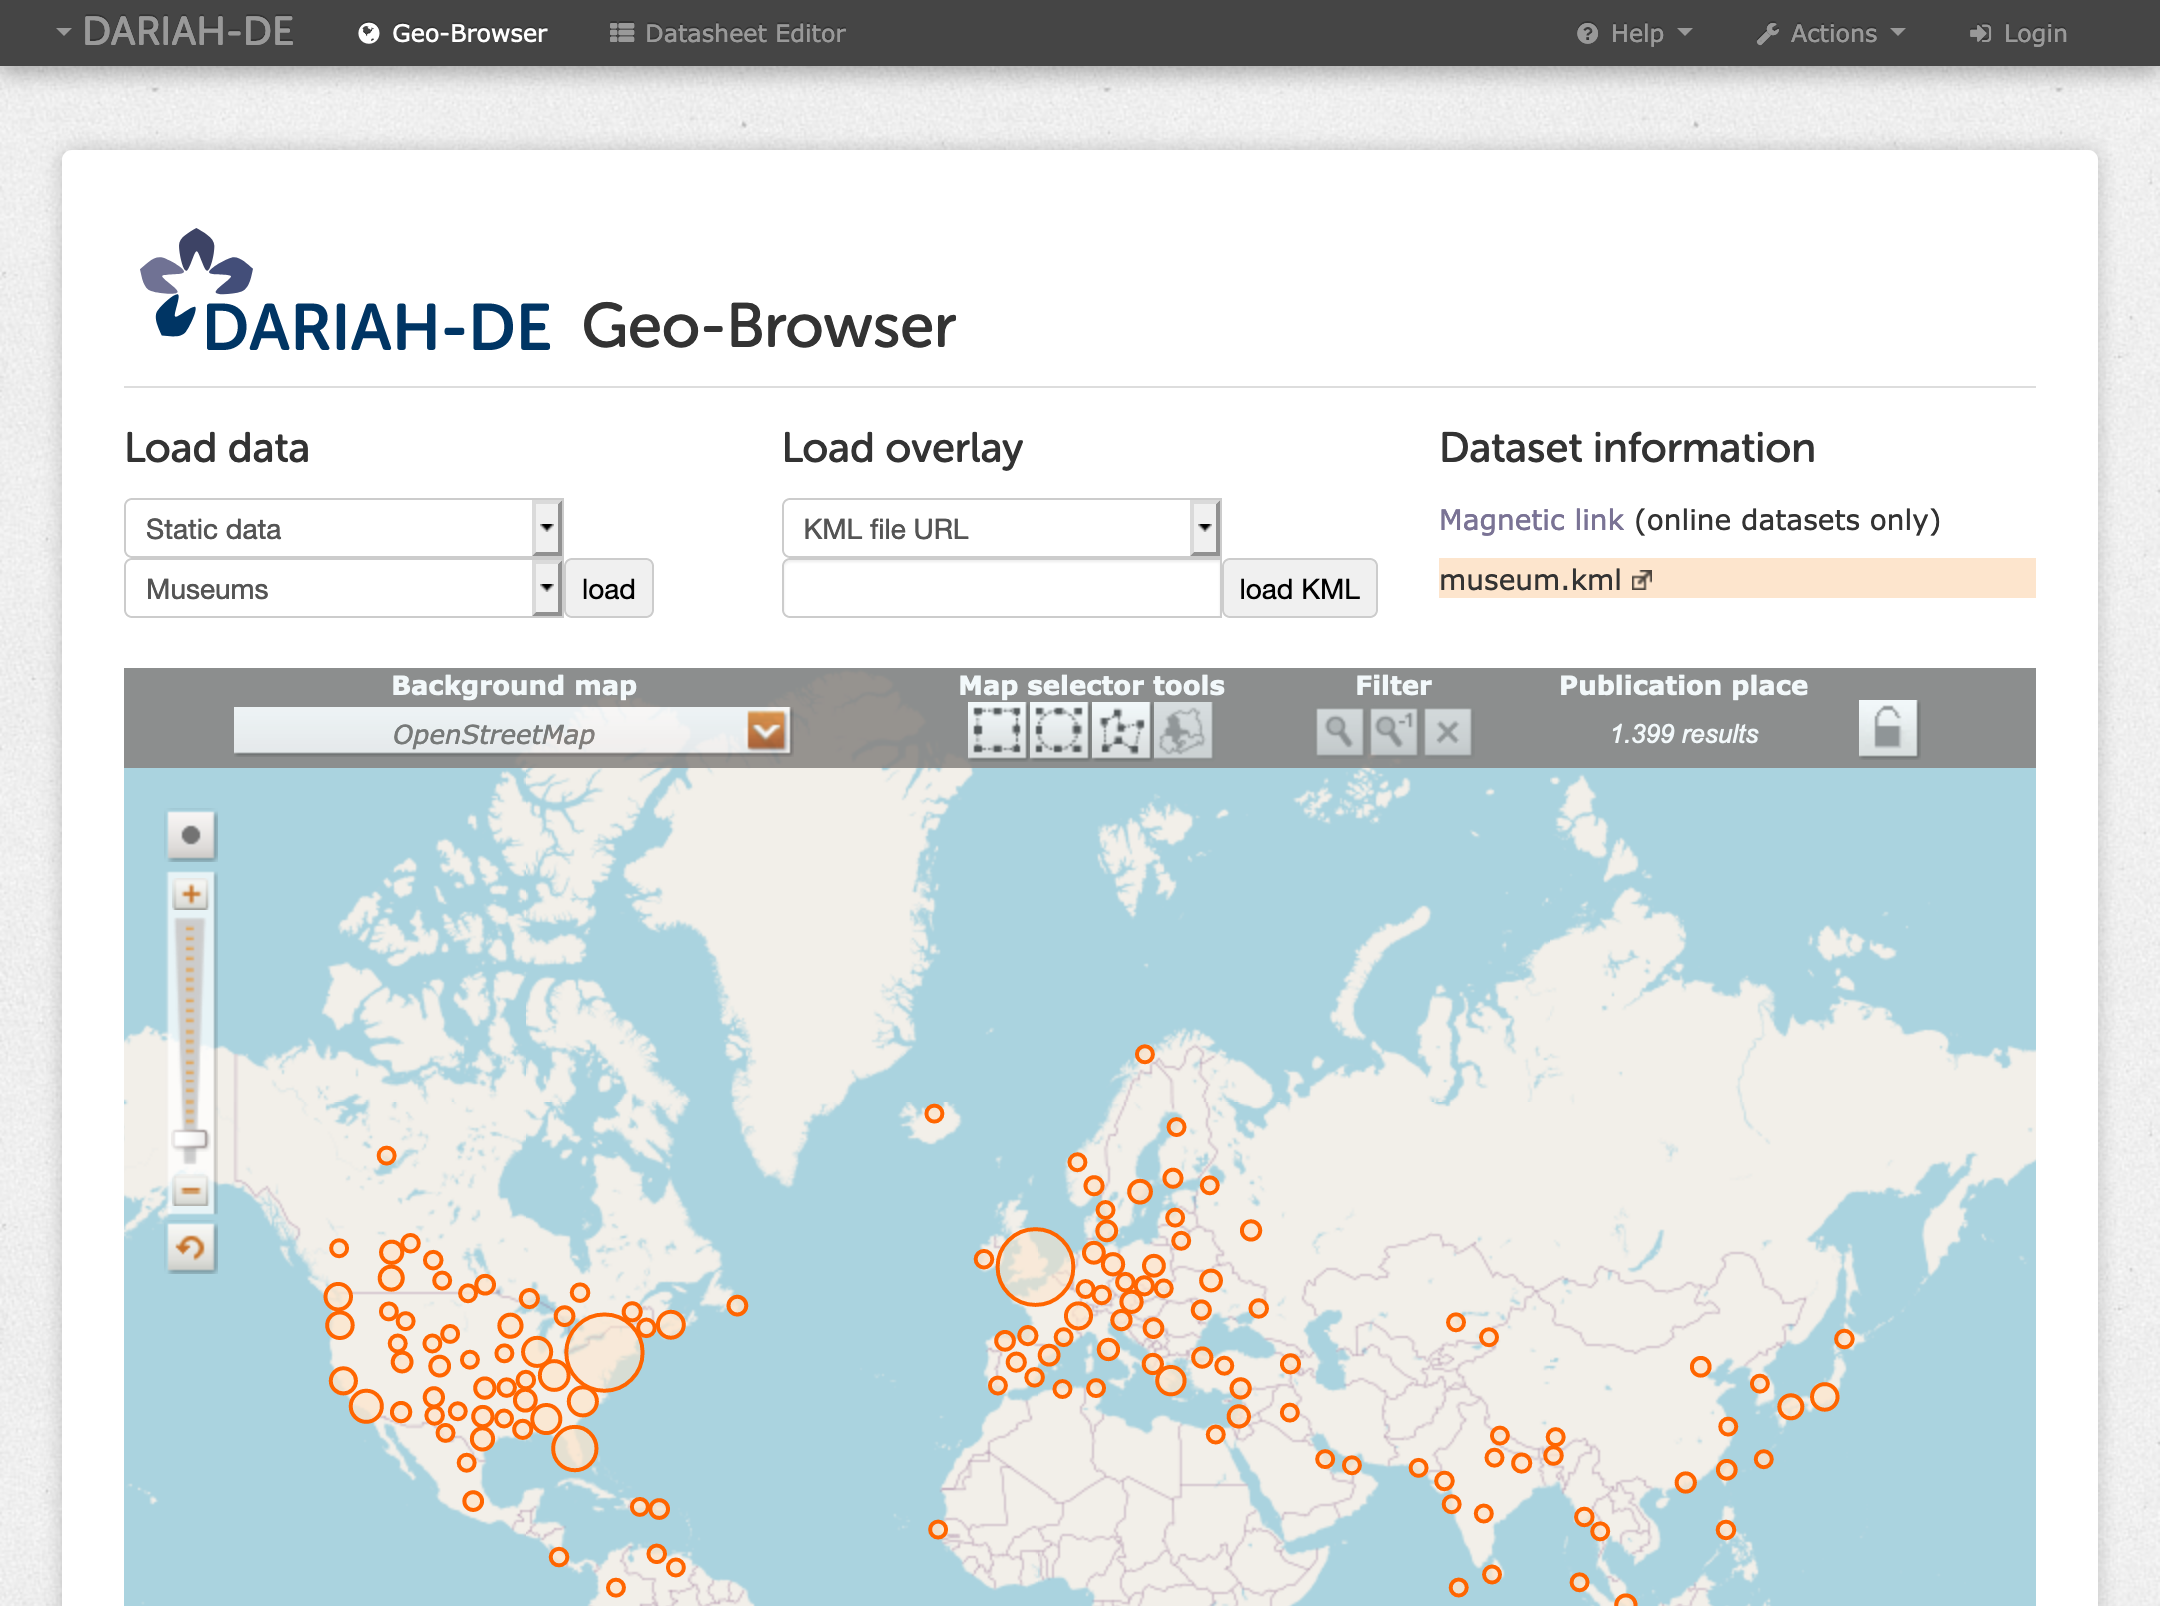
Fig. 2: Load local data – Museums
On “KML file URL“ you can upload KML files via the URL. KML files can be created with the GoogleMaps-Engine, among others. Here you can create a map which can be downloaded. The downloaded data is a KMZ file, which can be converted to a KML file with e.g. 7-zip, or you can upload the KMZ file directly.
For uploading KML files from your local hard drive, you have to choose “local KML file”.
You can also do this with a CSV file. Note: When you are using Windows, you can create CSV files with e.g. Microsoft Excel or OpenOffice Calc. When you are using Mac OS X you can create CSV files with Numbers.
If CSV files are loaded from the DARIAH-DE Storage, those files are either publicly available and are directly viewed in the Geo-Browser (means they were shared from within the Datasheet Editor) or they are private. In the latter case there will be either a redirection to the DARIAH AAI for authentication or the user already is logged in – for example in the Datasheet Editor – so the file can also be viewed. Private files are only viewed for authenticated users that are owners of these files.
The loaded data is represented on the map by colored circles. By double clicking a colored circle, the category and the number of hits for this specific area will be displayed.
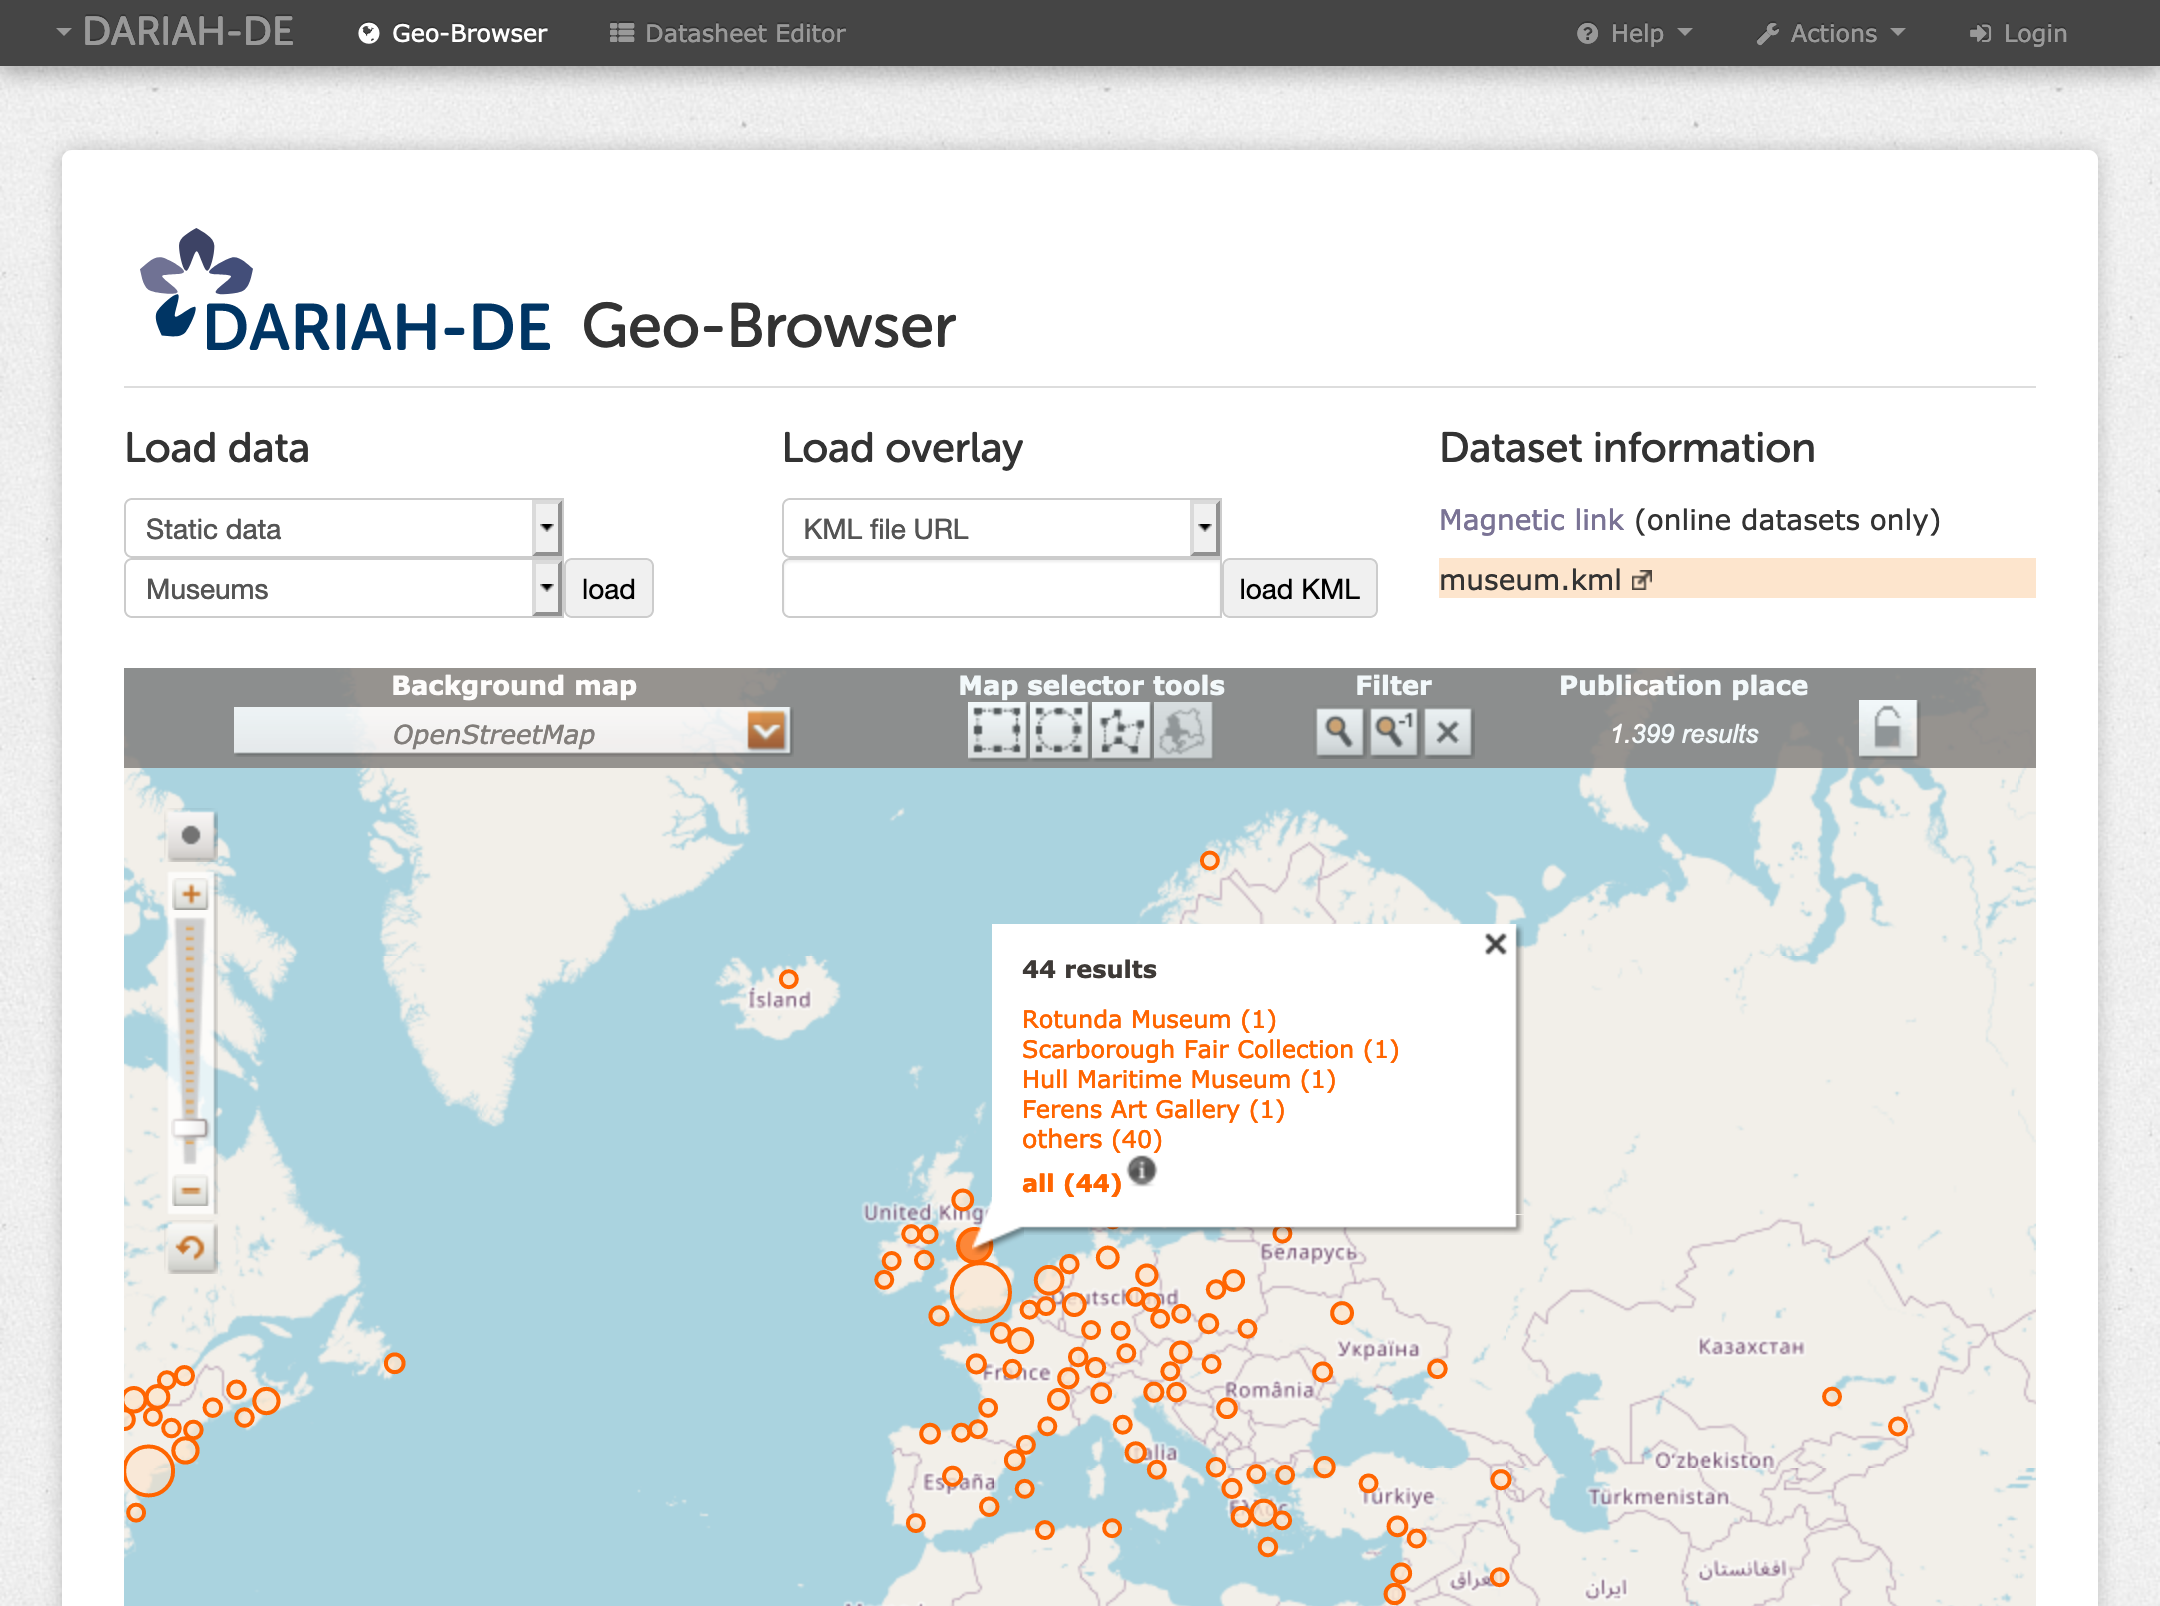
Fig. 3: Category and number of hits for a specific area
When different categories are uploaded, they will be displayed in different colors. At the bottom right of the map, a legend with colors and the corresponding categories will appear.
Load Overlay
On “Load overlay“ in the upper field you have to choose the data type of the file which you want to use as the overlay. An overlay is a graphical map which you can superimpose on the original map. For example you can load locations from a current map and create an Overlay of a historical map, and therefore see the current and historical positions of the locations. You can also use URL’s from KML and KMZ files, using the options “KML file URL“ or “KMZ file URL“.
By clicking on “ArcGIS WMS“ you can specify a WMS-Server-URL and a layer which should be shown.
Besides the latitude and longitude, the “XYZ layer“ also provides “thickness”. You can use a URL with x/y/z placeholders (it is the same format as used in OpenLayers.) “Roman Empire“ imports the Digital Atlas of the Roman Empire. s
Dataset Information
Magnetic link: Once the data is loaded in the Geo-Browser, it can be opened in “Dataset” as a “Magnetic link”, if available online. Local CSV and KML files can not be provided in magnetic links. By clicking on “Magnetic link” every currently referenced dataset and map params can be called again, always in a new tab in your browser.
Download: If you click on the arrow up right beneath the filename you can download the referenced file to your machine. The file must be publicly available or you have to be logged in and be owner of the file.
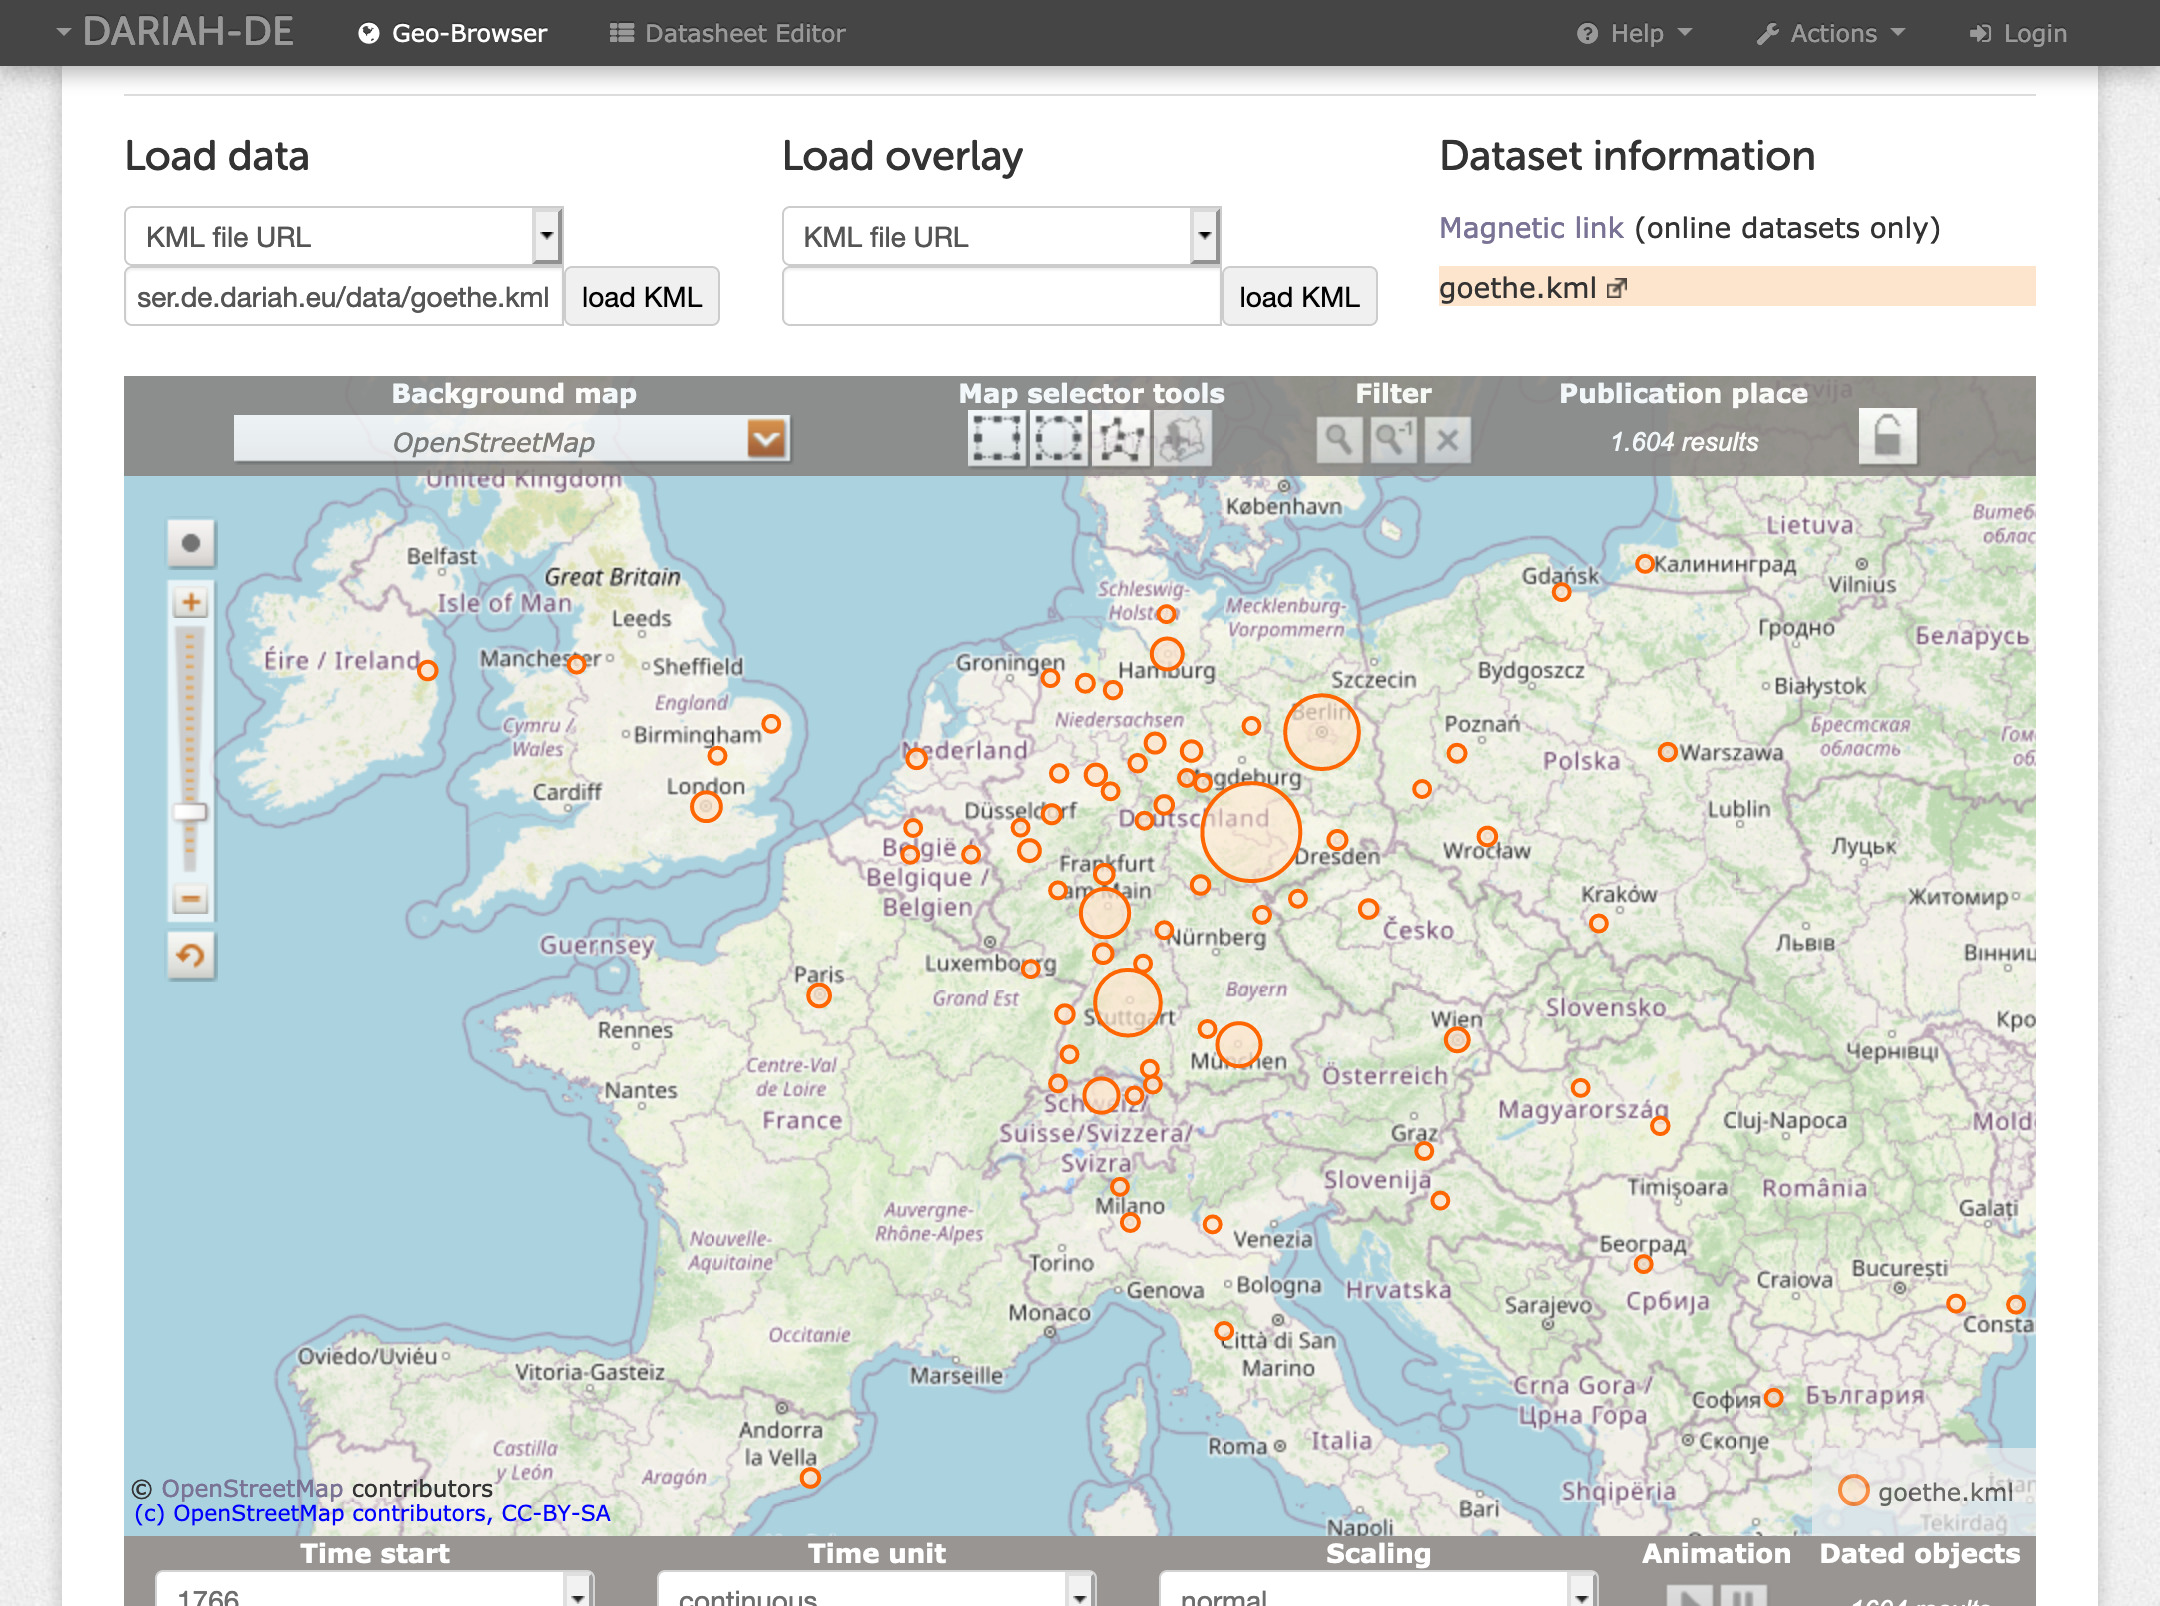
Fig. 4: Magnetic link and download
Upload to DARIAH-DE Storage: Via [upload to DARIAH-DE Storage] you can upload your local CSV Files to the DARIAH-DE Storage and share them publicly. Your file will get an ID and will be visible for others using the magnetic link.
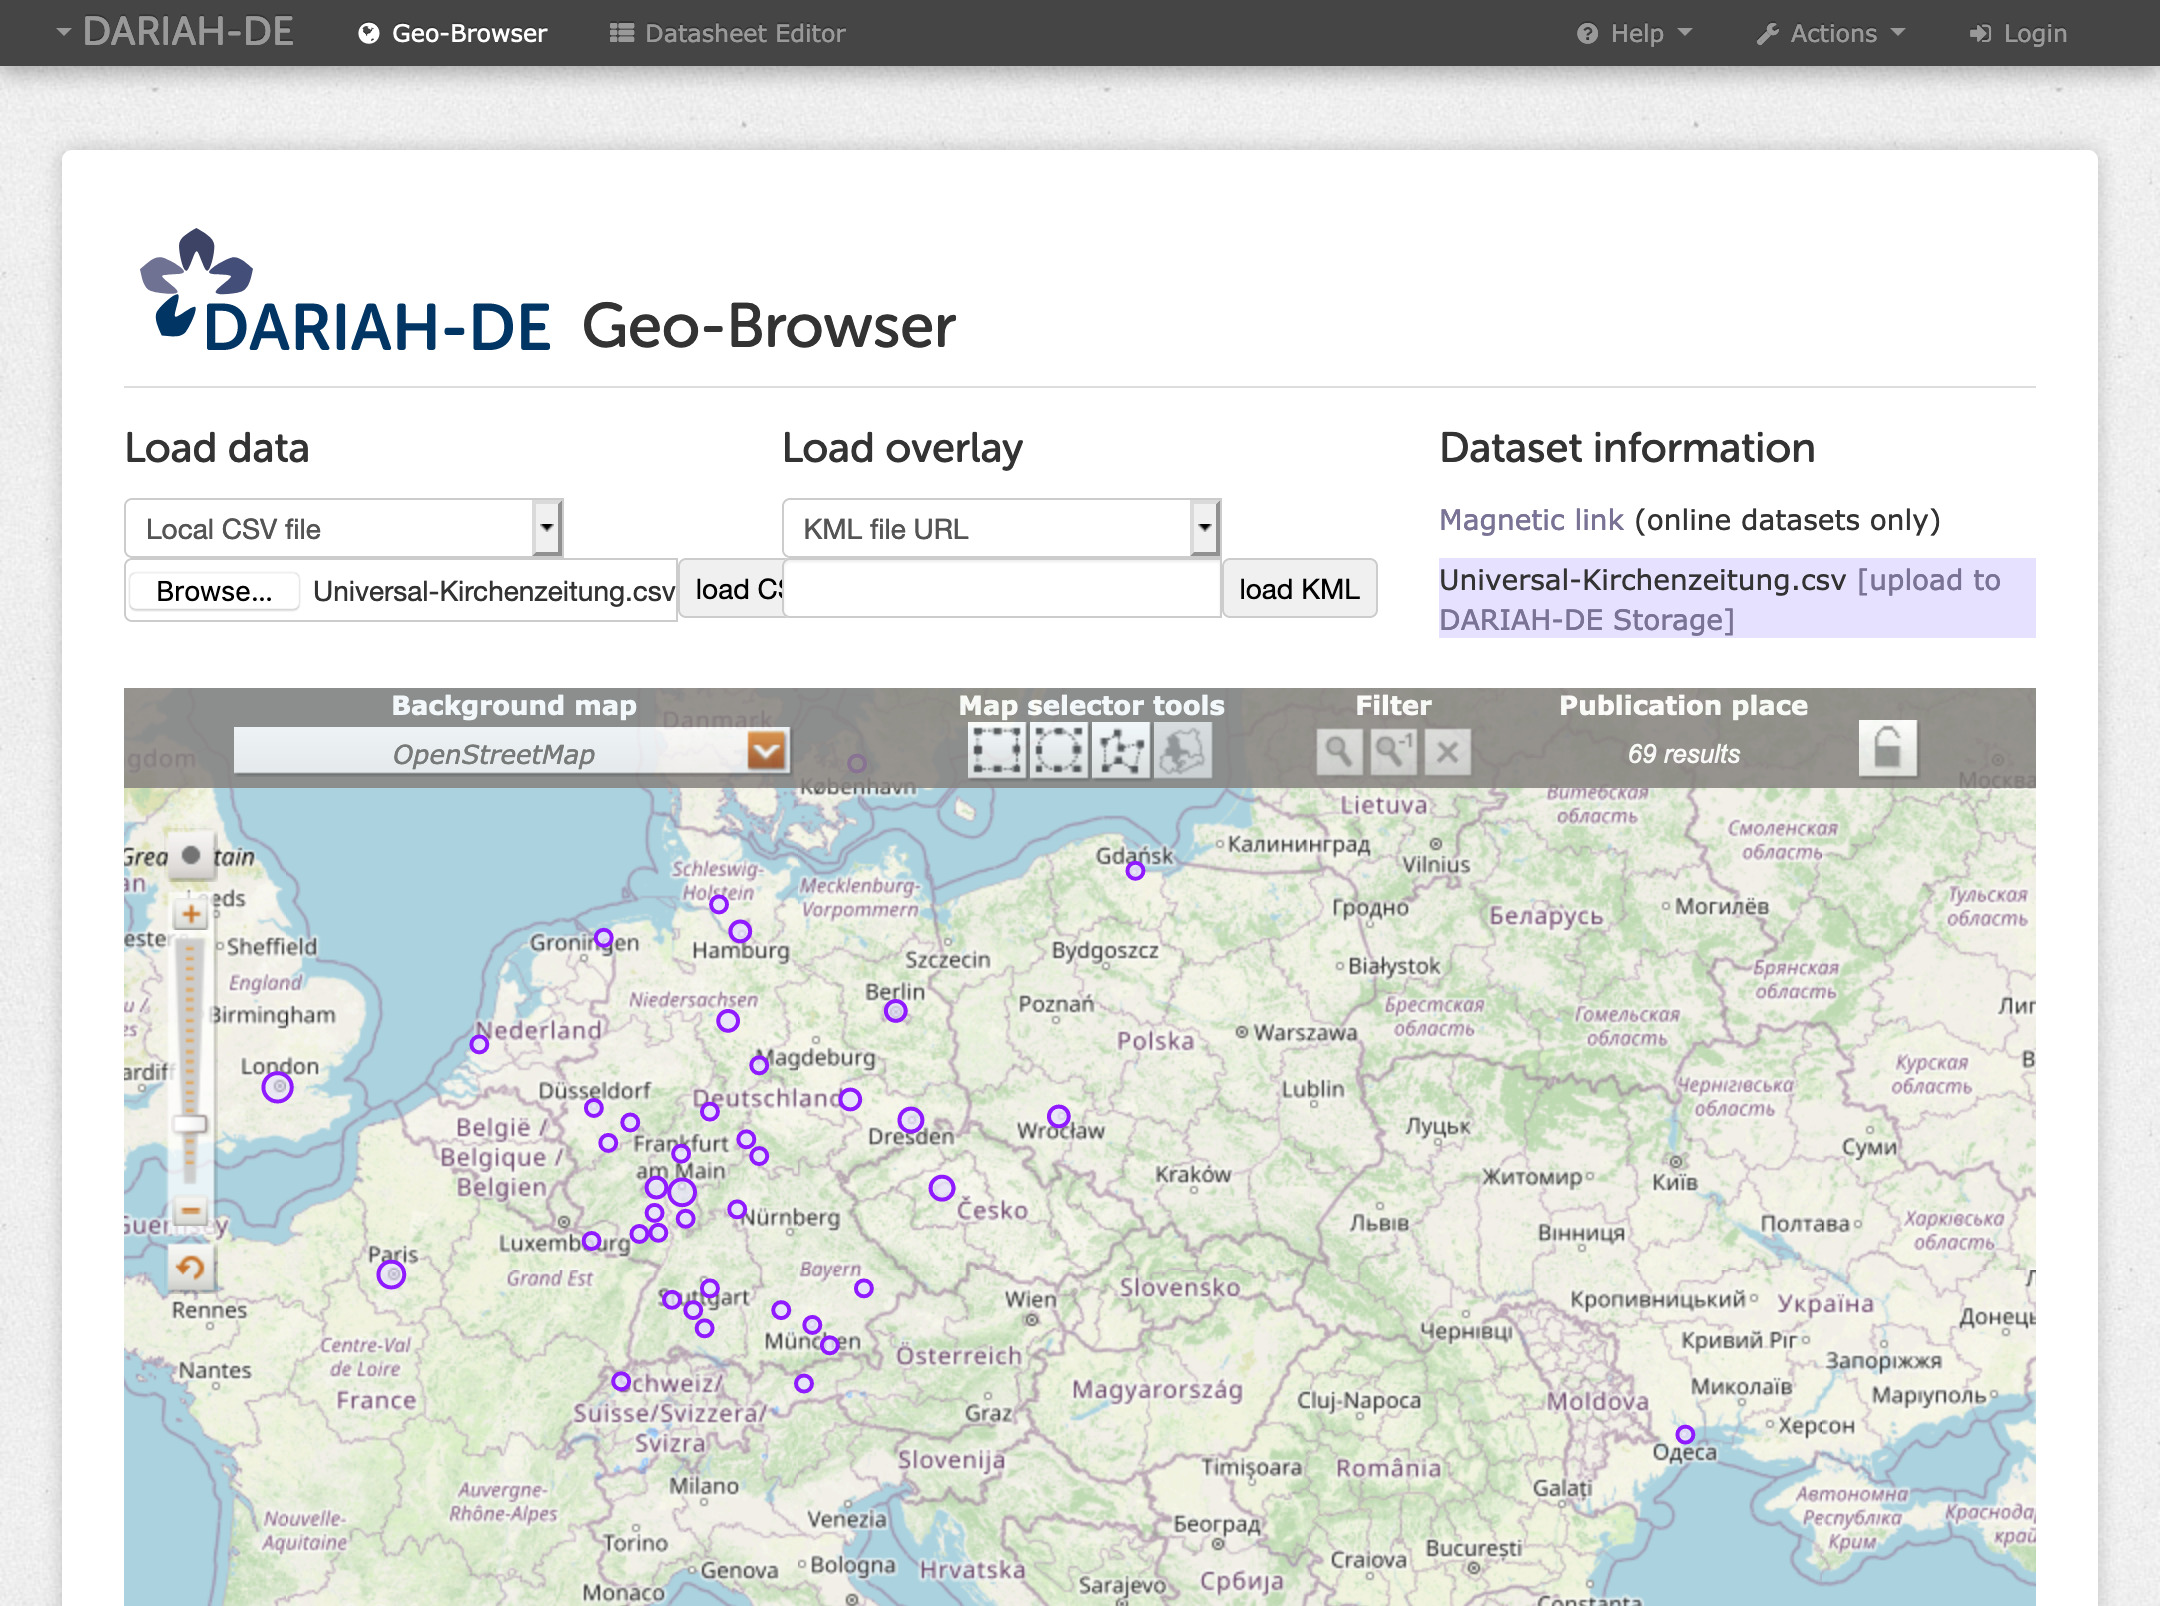
Fig. 5: Upload your local CSV file to the DARIAH-DE Storage
Open datasheet: Using [open datasheet] you can open CSV files directly in the Datasheet Editor, as long as they are publicly available or you are logged in and you are owner of the file.
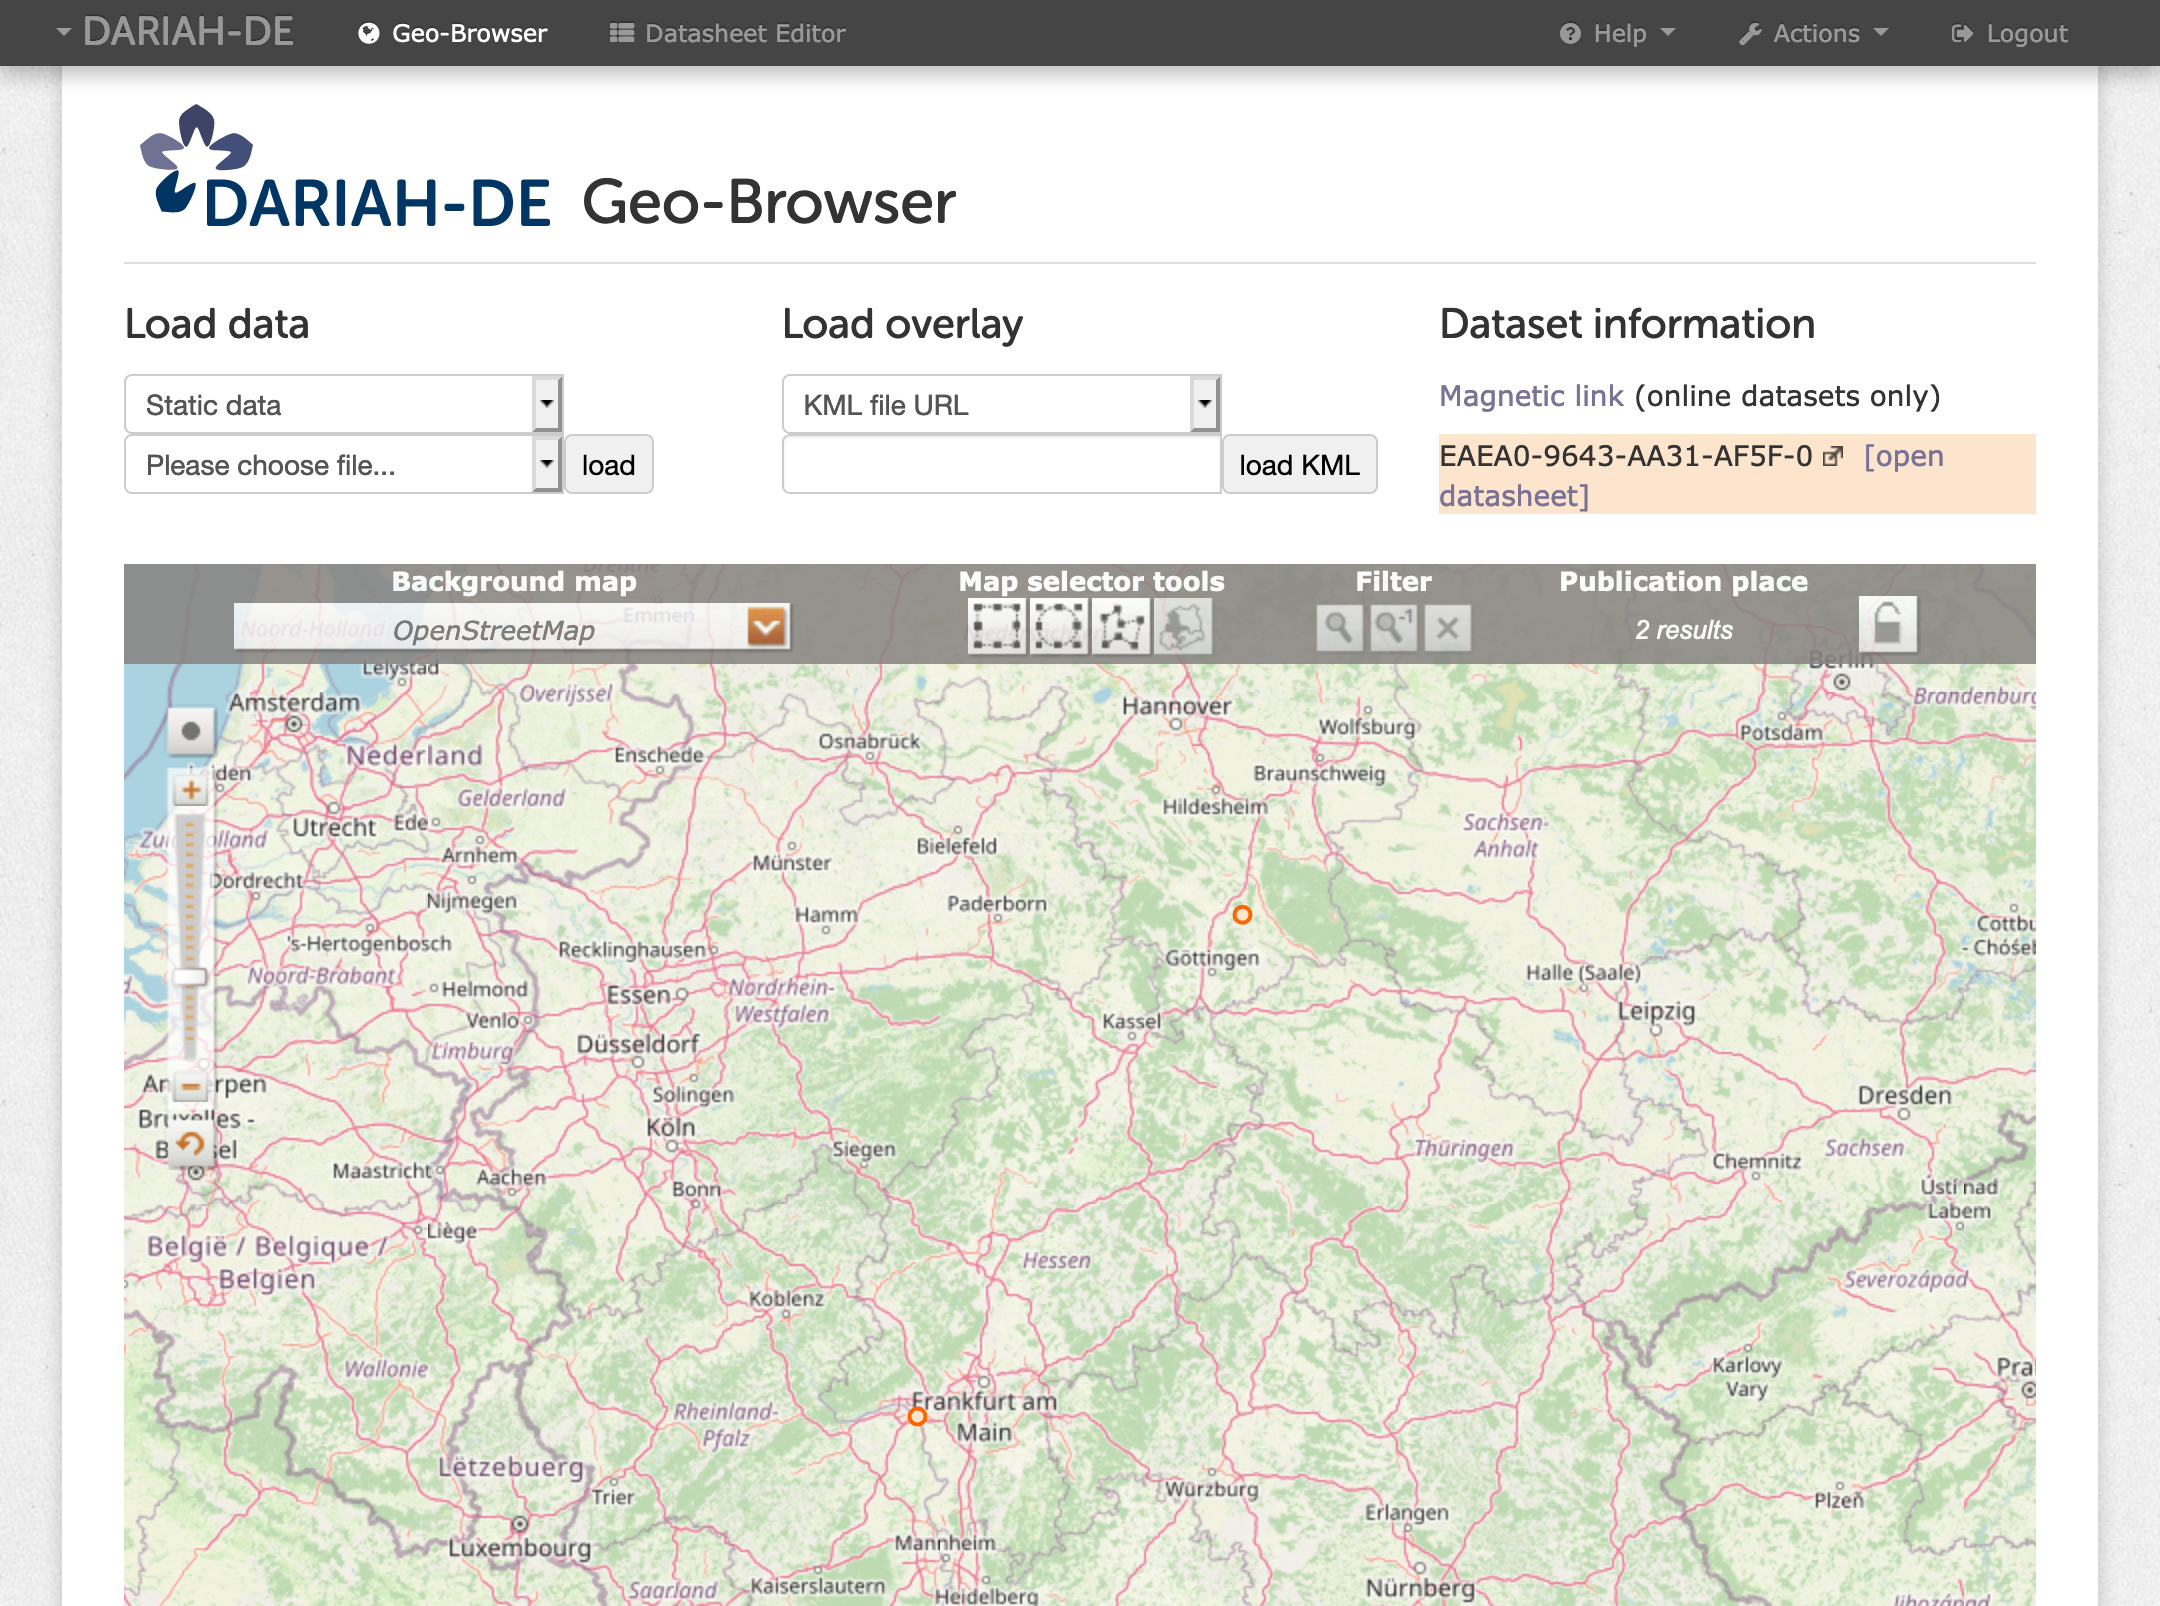
Fig. 6: Open your datasheet in the Datasheet Editor
Background Map
There are several options for the map in the background. There is a current map “Contemporary map (2014)“, there are historical maps, the oldest map is from 2000 BC. There is a map of the “Barrington Roman Empire“, a map of the antiquity in between 550 BC and 640 AD. Open Street Map (Map Quest) is set by default, which shows streets, national borders, mountains, vegetation and deserts.
Map Selector Tools
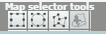
For marking locations on the maps with geometrical forms, you can use the “Map selector tools“. By clicking on a form, this from can be marked on the map. Here you can choose a rectangle, a circle or a flexible form with the possibility to mark dots on the map by clicking, which get connected. For completing the form you have to click twice on the last dot. Once an area is chosen, all the locations within are marked on the list of results.
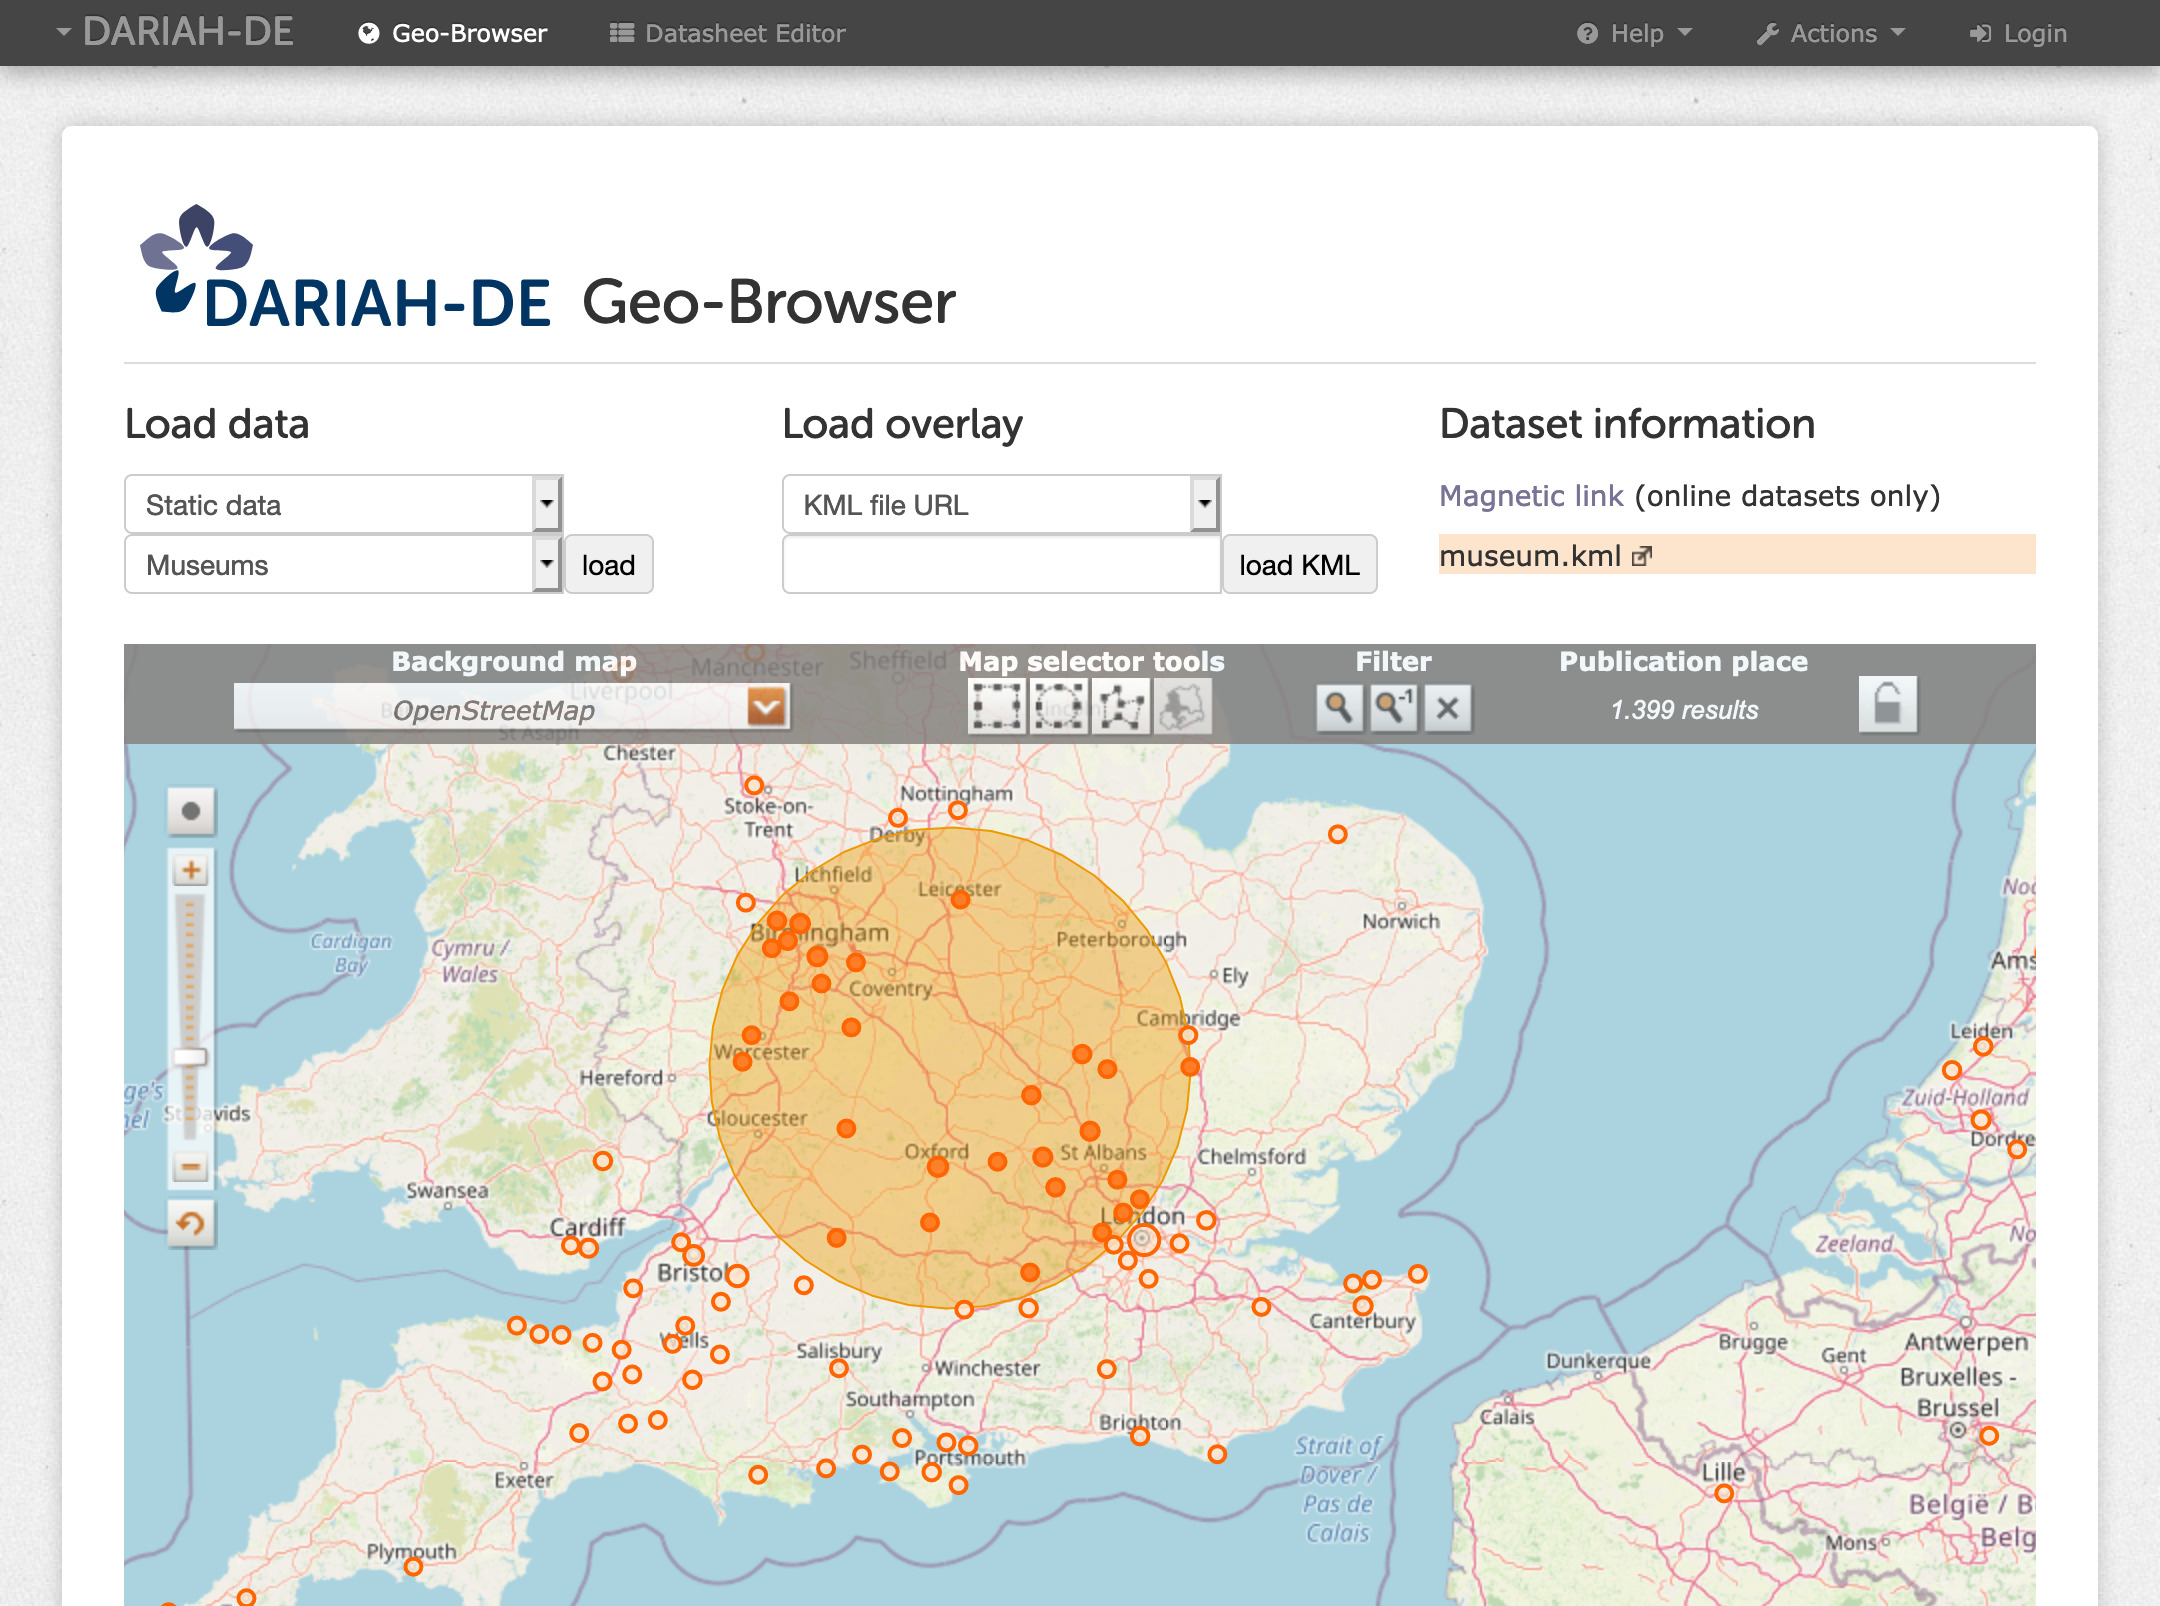
Fig. 7: Map selector tools – select a circle
Furthermore there is the possibility to mark states – currently this is only working with the historical maps.
Filter

For filtering specific data in an area, previously marked with the Map Selector Tool, you can use this filter. The data will then be invisible in the Geo-Browser.
Publication Place
“Publication place“ shows how many results exists for search queries in various places.
Timeline and List of Results
When data is loaded in the Geo-Browser, a timeline appears under the map. This timeline shows a chronological sequence of the data. Under the timeline is a list of results.

With “Time start“ you can choose a starting time for the timeline.
The “Time unit“ can be chosen here: The options range from “continuous“ to 500 years. The chosen unit will be displayed as boxes. With the selection window “Scaling” you can change the scale of the graph from “normal“ to “logarithm“ and “percentage“.
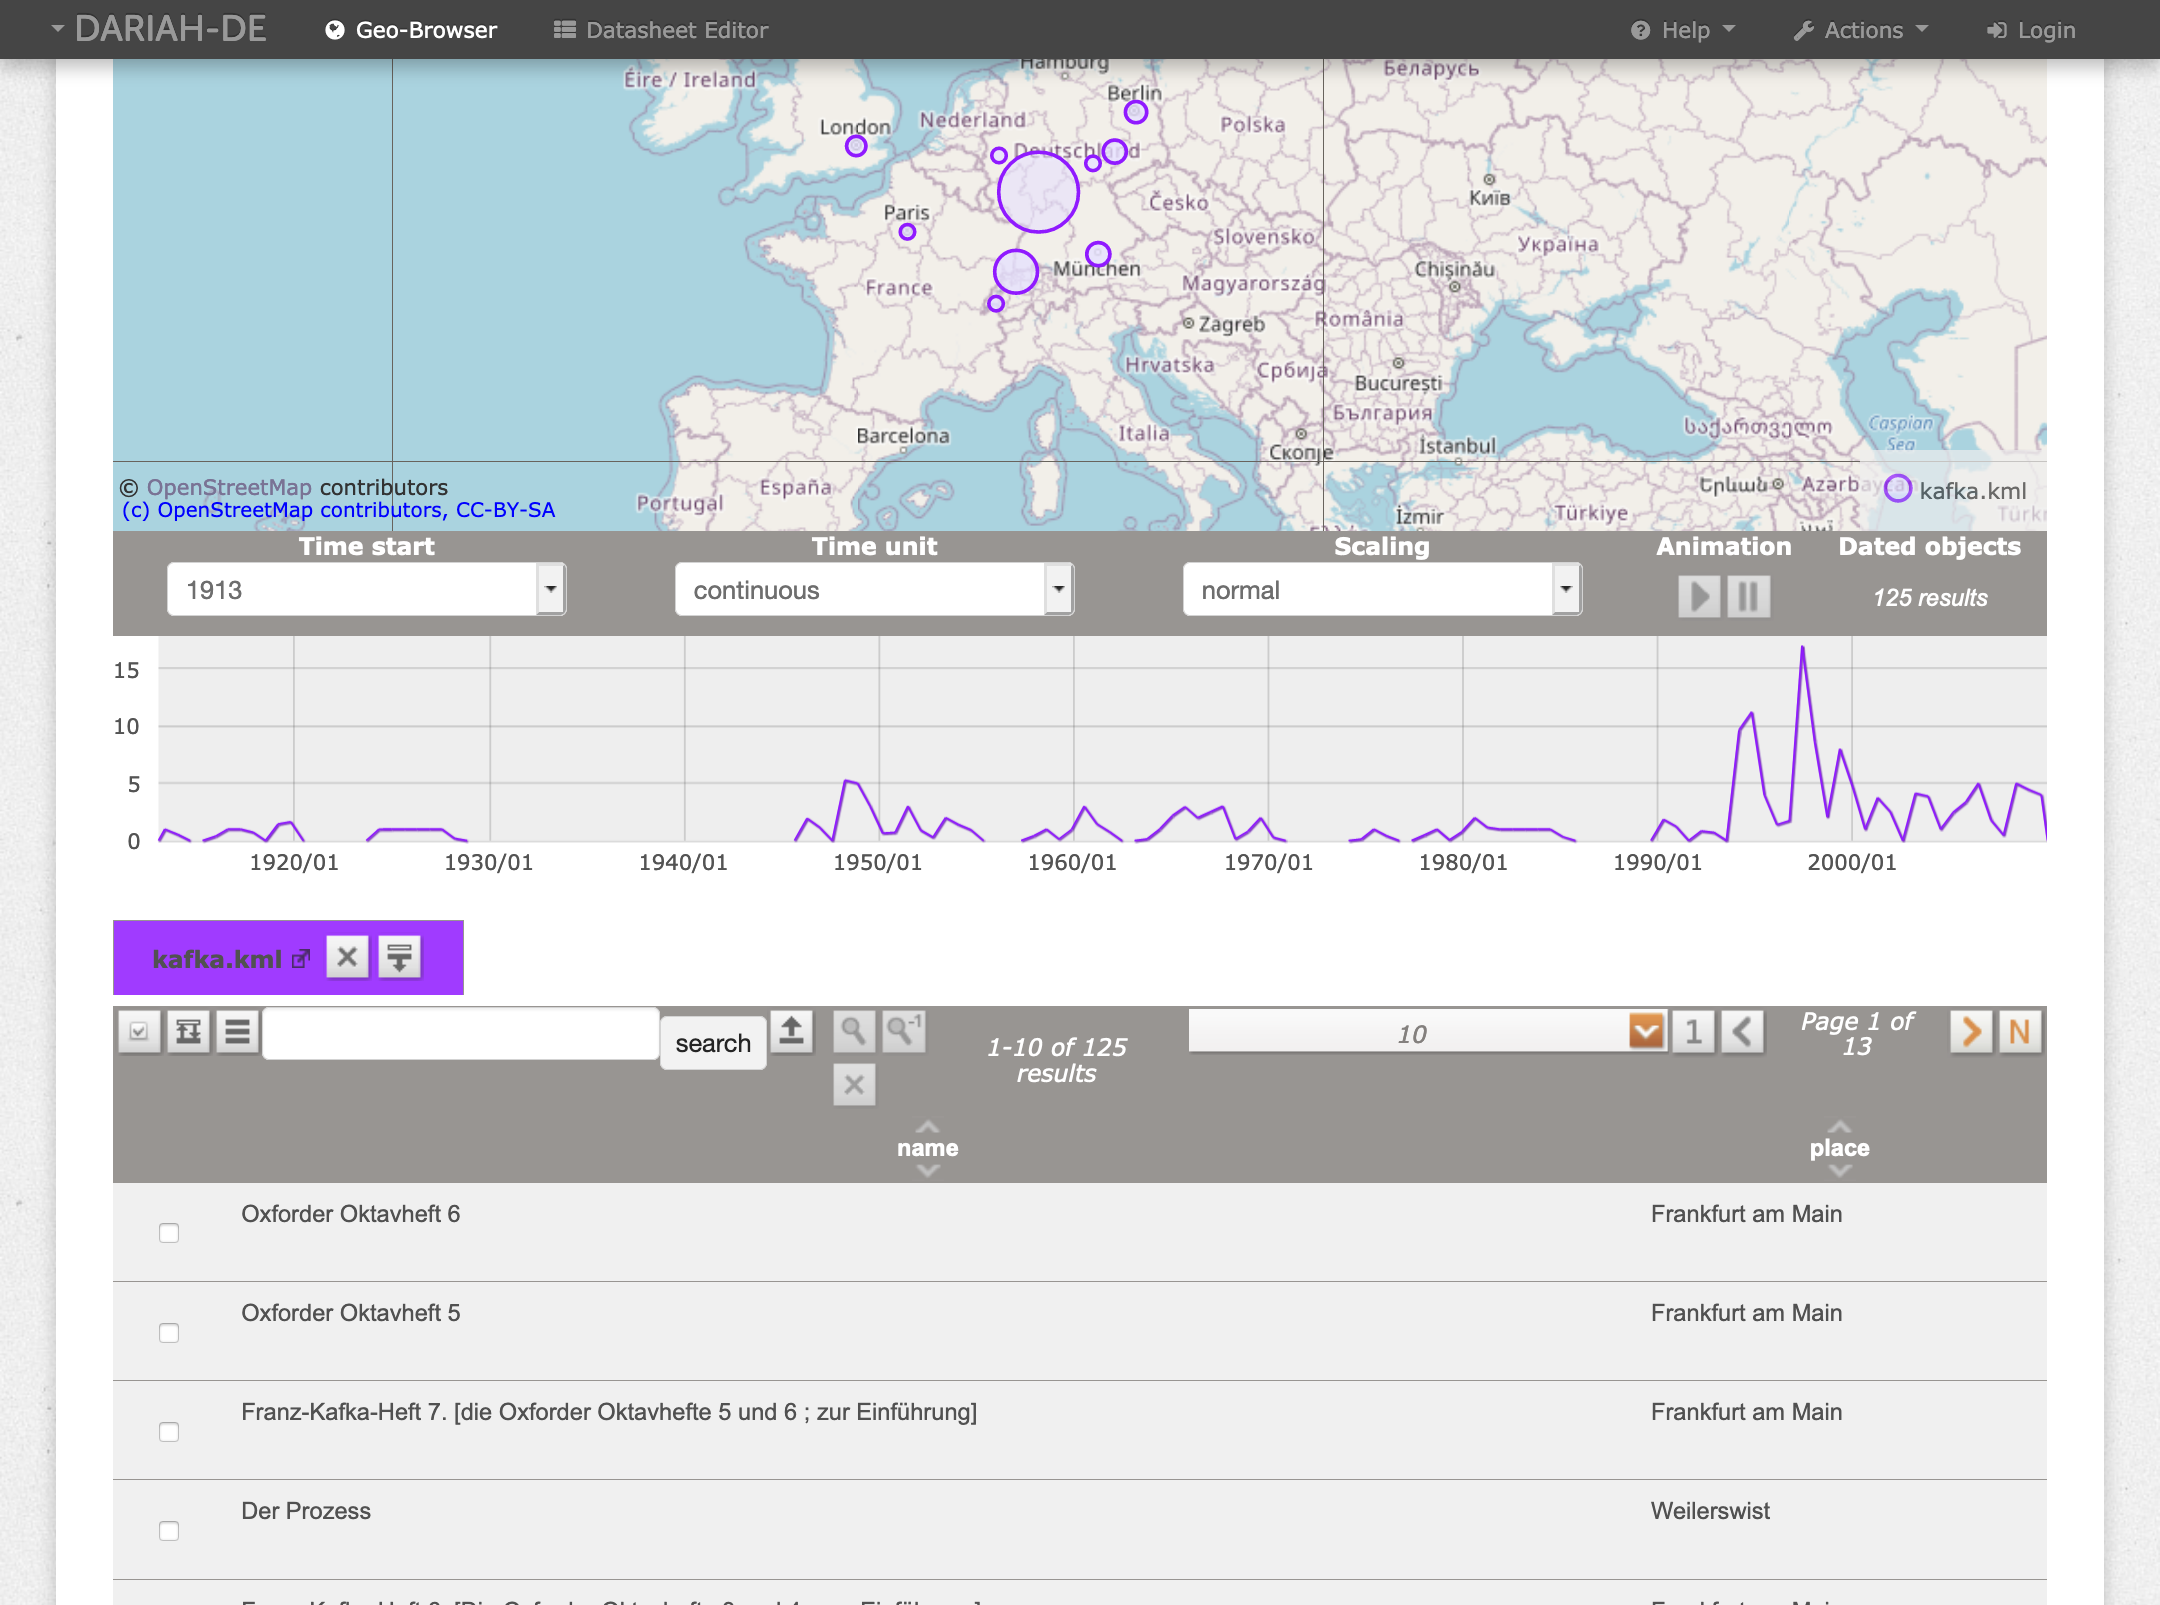
Fig. 8: Timeline and the list of results (Franz Kafka OPAC data)
Animation
To start an animation, you have to choose an area in the timeline. You can choose it by clicking in the timeline.

With the “play“ button you can start a demonstration: The marked area passes through the timeline from left to right through the timeline, while the locations which are linked to a certain time span blink on the map. Below the timeline you can see an orange box.

Clicking this button will delete the loaded data.

Clicking this button allows you to download them as a KML file. Below the orange box is a list of results.

For hiding them you can use this button. You can choose how many results you want to see on one page (10 to 100).

You can see the following page by clicking this button.

Shows you the first page.

Shows you the last page.
Maps
Unless differently indicated, the Geo-Browser uses free maps and charts which are made available through the DARIAH-DE GeoServer, e.g. the historical maps were used within the scope of the project europeana4D for the predecessor of the Geo-Browser (e4D). The historical Maps of ThinkQuest Team C006628 are “in most cases only meant to be used on a large scale, so that only the relative position of countries should be trusted. It is estimated that political boundaries have an average error of 40 miles.“ (see Disclaimer)
Other used maps are integrated online by other suppliers/services, for example, maps of OpenStreetMap and MapQuest. License information can be found at the bottom of the map view.
The map of the Roman Empire (Digital Atlas of the Roman Empire) was developed by Johan Åhlfeldt, supported by the project Pelagios.
Versions and Releases
You can find the current version of the Geo-Browser here: https://geobrowser.de.dariah.eu.
The CHANGELOG is available in the GIT repository of the Geo-Browser.
GIT Repository
- DARIAH-DE Geo-Browser Repository
- GeoTemCo
- PLATIN fork used in the DARIAH-DE Geo-Browser (mainly adapted configuration)